 Bitcoin News
Bitcoin hash ribbon signal marks end of miner capitulation

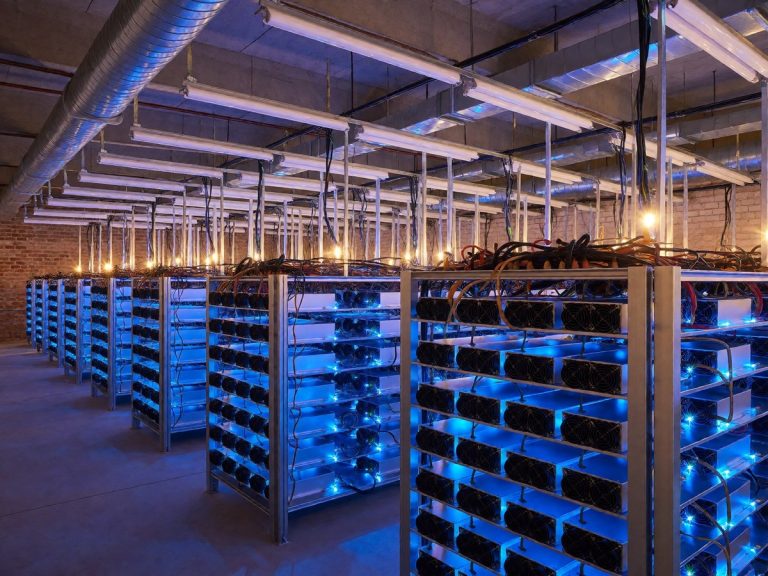
The 30-day moving average of the Bitcoin hashashrate crossed above the 60-day moving average, signaling that the period of miner capitulation ended. This Hash Ribbon buy signal follows months of intense pressure where miners operated on sub-5% margins. I view the 30-day and 60-day simple moving averages (SMA) of the hashashrate as the primary tools to track these shifts. When the 30-day SMA falls below the 60-day SMA, miners enter a phase of capitulation. This occurs when equipment maintenance and energy costs exceed the price of Bitcoin for one to two months. The reverse crossover I see now implies a return of conviction among miners. This has often been followed by bullish price action. This indicator aims to pinpoint when certain behaviors become dominant. The Hash Ribbon indicator has provided useful entries in the past, such as during the 2023 recovery from the 2022 bear market and the mid-2021 mini-bear phase. I would skip a signal that lacks price momentum, so I combine the Hash Ribbon with the 10-day and 20-day price SMA crossover. In January 2015, the indicator produced a bad entry where the price fell 42% after the signal. A signal in August 2023 at $44,612 led to a loss of over half its value as Bitcoin fell below $20,000. You already know the basics of hashashrate, so I will focus on the specific crossovers. When the 30-day moving average of the Bitcoin hashashrate crosses above the 60-day moving average, it signals that the worst of the miner capitulation is over and the market recovery has finally begun to materialize.
Economics and difficulty
The economic reality for miners is tight as Bitcoin trades near its production cost. Charles Edwards of Capriole Investments estimates production costs at $61,200 and electrical costs at $48,965, which results in a miner margin of 4.67%. This margin is near two-year lows. Because Bitcoin difficulty is adjusted every 2016 blocks, the metric stays tied to the network hashashrate. The latest difficulty retarget on September 19, 2026, pushed the metric to 132.76 trillion, a 4.16% increase from the previous 127.45 trillion. As of October 17, 2026, the difficulty is 140.58 trillion. Difficulty is the amount of hashes required to find a valid block hash. This metric is a 256-bit number. A higher difficulty means more computational work is required per block. The network maintains a block time of about ten minutes through the difficulty adjustment algorithm. The network calculates difficulty by measuring the time it took to find the last 2,016 blocks and comparing it to the expected 20,160 minutes. If blocks are mined faster than ten minutes, difficulty increases. If miners find blocks slower than ten minutes, difficulty decreases.
| Metric | Value |
|---|---|
| Current Bitcoin Difficulty (Oct 17, 2026) | 140.58T |
| Production Cost | $61,200 |
| Electrical Cost | $48,965 |
| Miner Margin | 4.67% |
| Foundry USA Pool Share | 24% |
| AntPool Share | 20% |
| F2Pool Share | 15% |
| ViaBTC Share | 9% |
| Puell Multiple | 1.17 |
Hashrate and pool dominance
The network hashashrate shows constant fluctuation between 782 EH/s and 950 EH/s. On September 23, 2026, live readings hovered around 782 EH/s. This volatility stems from regional power availability or the shutdown of marginal equipment. Foundry USA Pool maintains a 24% share of the network hashashrate based on recent 7-day data. AntPool holds 20%, while F2Pool and ViaBTC hold 15% and 9% respectively. These pools aggregate resources from thousands of miners to provide payouts through methods like PPLNS. The hashashrate measures the speed with which mining techniques solve cryptographic tasks. It is measured in hashes per second. Variations in hashashrate reflect the total processing power of the Bitcoin network. The reward for mining a block is 3.125 BTC plus transaction fees. Mining difficulty is tightly coupled to hashashrate. When more miners join or more efficient hardware comes online, blocks arrive faster than the ten-minute target until the next retarget raises difficulty. When miners leave, block times slow down and the next adjustment lowers difficulty.
The $74,000 signal and market context
The $74,000 Hash Ribbon signal provides a different perspective than the recent $94,100 price level. I recommend the Hash Ribbon signal for identifying long-term entries, but the efficacy of these signals may diminish as institutional participation grows. In 2022, the price bottomed near $15,500 when miners faced maximum stress. The Puell Multiple currently sits at 1.17, which is far below the historical tops seen at 6.72 or 10.1. Will the $60,000 psychological level act as a barrier if the current recovery stalls? The 2011 cycle saw a bottom at $2 after a 94% drawdown. During the 2013 to 2015 period, the price bottomed at $175 after an 85% drawdown. This was followed by a 2017 to 2018 cycle bottom of $3,200, which was an 84% drawdown. Finally, the 2021 to 2022 cycle bottomed at $15,500 after a 78% drawdown. The 2022 bottom occurred near $15,500 when miners faced peak stress. The $60,000 level acts as a psychological floor. If the miner capitulation drags on and the price fails to reclaim the production cost level quickly, financial stress could force another round of selling from leveraged mining firms.