 Bitcoin News
Bitcoin mining energy reality: renewable data and grid integration

Renewable Energy and Hardware Efficiency
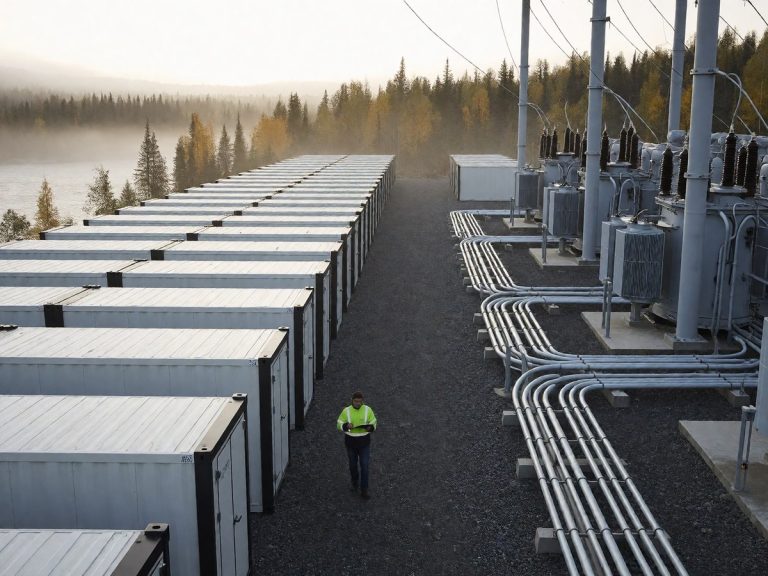
The Digital Assets Research Institute reports that 56.7% of the Bitcoin network uses sustainable energy, which is an increase from 34% in 2021. This shift occurs because miners seek the most affordable power available. The Cambridge Centre for Alternative Finance reported in April 2025 that 52.4% of mining electricity comes from zero-emission sources. This total includes 42.6% renewables and 9.8% nuclear. The renewable portion includes 23.4% hydropower, 15.4% wind, and 3.2% solar. Natural gas makes up 38.2% of the mining energy mix, while coal accounts for 8.9%. Miners move to regions with high renewable capacity, such as Quebec, British Columbia, and Norway. In Paraguay, mining operations grew 54% year-over-year because of the Itaipu Dam surplus. Ethiopia hosts roughly 600 MW of mining operations powered by the Grand Ethiopian Renaissance Dam.
Hardware efficiency also changes the energy footprint of the network. The Bitmain Antminer S21 XP+ Hyd produces 500 TH/s while consuming 5,500W, which results in an efficiency of 11 J/TH. The newer Bitmain Antminer S23 series achieves 9.5 J/TH with hydro cooling. Miners also capture stranded energy to lower emissions. In Canada, a prototype system capturing gas at oil wells reduced carbon emissions by over 10,000 tons in one year. China also continues to expand its clean energy capacity, with wind and solar generation rising 27% in the first half of 2025 compared to the same period in 2024.
Market Consolidation and the AI Transition
Foundry USA commands 30% of the global hashashrate, while AntPool holds 18.2% and F2Pool holds 15.2%. This concentration occurs because of a shift toward high-performance computing. Listed mining companies could derive 70% of their revenue from AI by the end of this year, up from 30% today. This transition follows a period where Bitcoin prices fell from $124,500 in early October to $86,000 by late December 2025. In late 2025, Bitcoin prices fell from $124,500 in early October to $86,000 by late December, which pushed hash prices to five-year lows of $29/PH/s/day in early 2026.
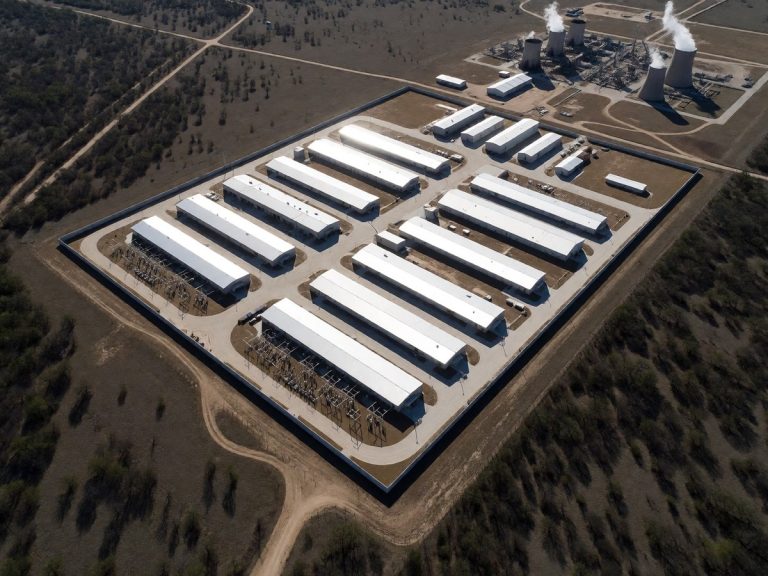
Companies like IREN have already scaled to 10,900 NVIDIA GPUs to support AI services. WULF has 39 MW of critical IT capacity online at Lake Mariner to support $12.8 billion in contracted HPC revenue. CORZ targets 590 MW for HPC by early 2027. IREN carries $3.7B in convertible notes, and WULF has $5.7B in total debt to fund these expansions. CIFR is developing the 300 MW Barber Lake site to support its transition. China retains an estimated 11.7% of the global hashashrate through semi-tolerated operations.
Grid Stabilization and Flexible Loads
Miners act as flexible grid assets by providing demand response. They can shut down operations in seconds when residential demand spikes. In Texas, Riot Platforms earned $30.6 million in power curtailment credits in the third quarter of 2025. These miners use stranded energy to mitigate environmental impacts. Companies like Crusoe Energy capture natural gas at oil wells to reduce greenhouse gas emissions by 63% compared to traditional flaring.
| Entity or Hardware | Data Point |
|---|---|
| Foundry USA | 30% hashashrate |
| AntPool | 18.2% hashashrate |
| F2Pool | 15.2% hashashrate |
| Bitmain Antminer S21 XP+ Hyd | 11 J/TH efficiency |
| Bitcoin Global Energy Use | 0.23% |
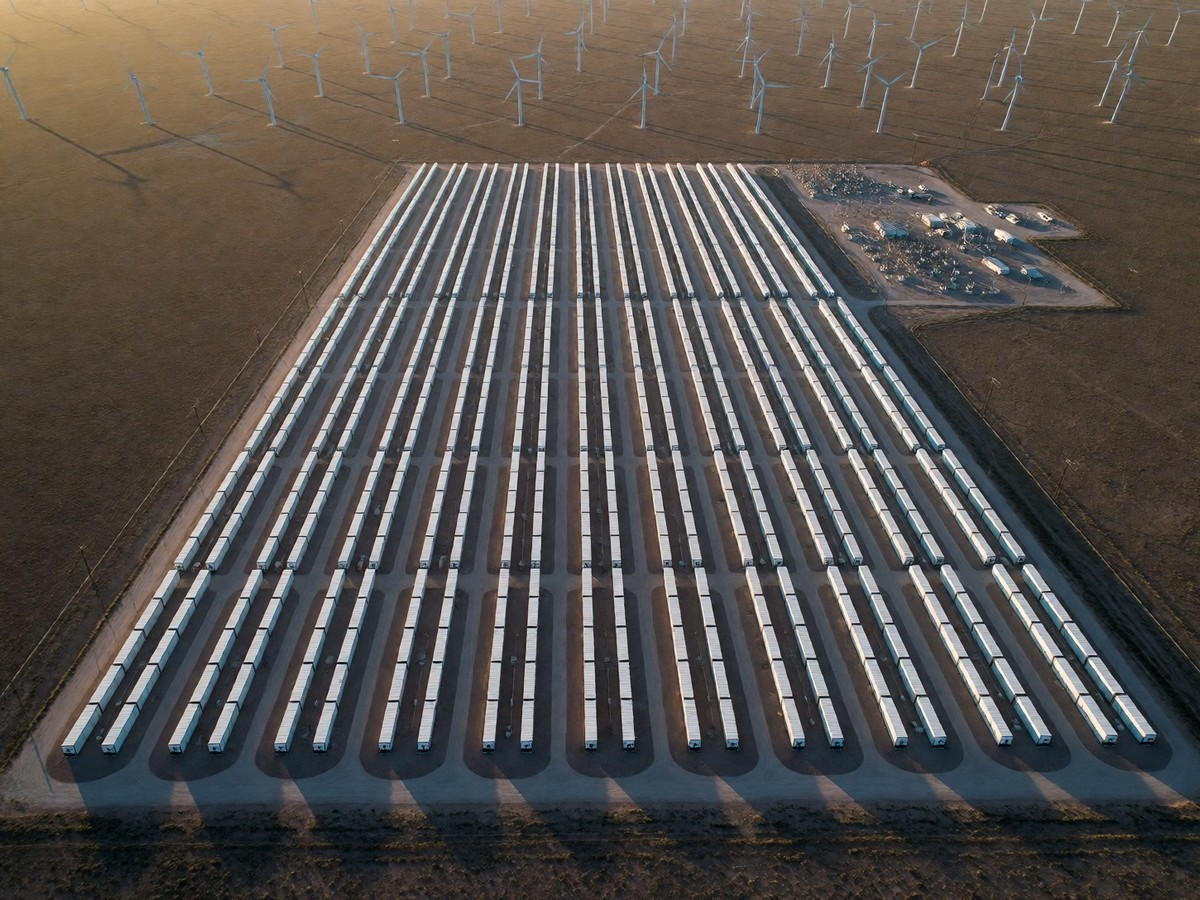
Miners find economic value in the "duck curve" of electricity demand. They purchase wind and solar power when production exceeds grid needs. This prevents the waste of renewable energy during the day or night. Miners in West Texas and the Midwestern United States use wind power that blows strongest at night. In California and Australia, miners use solar power during daylight hours. Marathon deploys 10 MW containerized sites at the edge of energy networks to suit intermittent energy. Texas’s ERCOT grid saw crypto mining demand reach 4,288 MW in November 2025. ERCOT expects this category to consume 54 billion kWh in 2025.
Environmental Models and Economic Comparisons
The Cambridge methodology calculates emissions using a best-guess estimate based on geographical distribution. It uses a hydro-only scenario for the lower bound and a coal-only scenario for the upper bound. These models account for the carbon intensity of different regions. Critics claim that Bitcoin mining causes immense pollution, but the network accounts for only 0.08% of global carbon emissions. Bitcoin produces the equivalent CO2 to 175 to 300 aircraft flying continuously, based on an annual consumption of 140 TWh. The traditional banking sector consumes 4,981 TWh of electricity, which is 50 times more than the energy used by Bitcoin. Gold mining consumes 240.61 TWh per year, which is more than the 113.89 TWh consumed by Bitcoin.
If you think the energy usage of a single transaction is a good metric, you should look at the total network security instead. The network uses 0.23% of global energy to maintain security. One question remains about the long-term effect of AI competition on mining energy costs.