 Ethereum News
Ethereum’s $2,600 floor faces test amid Bitcoin dormancy shifts

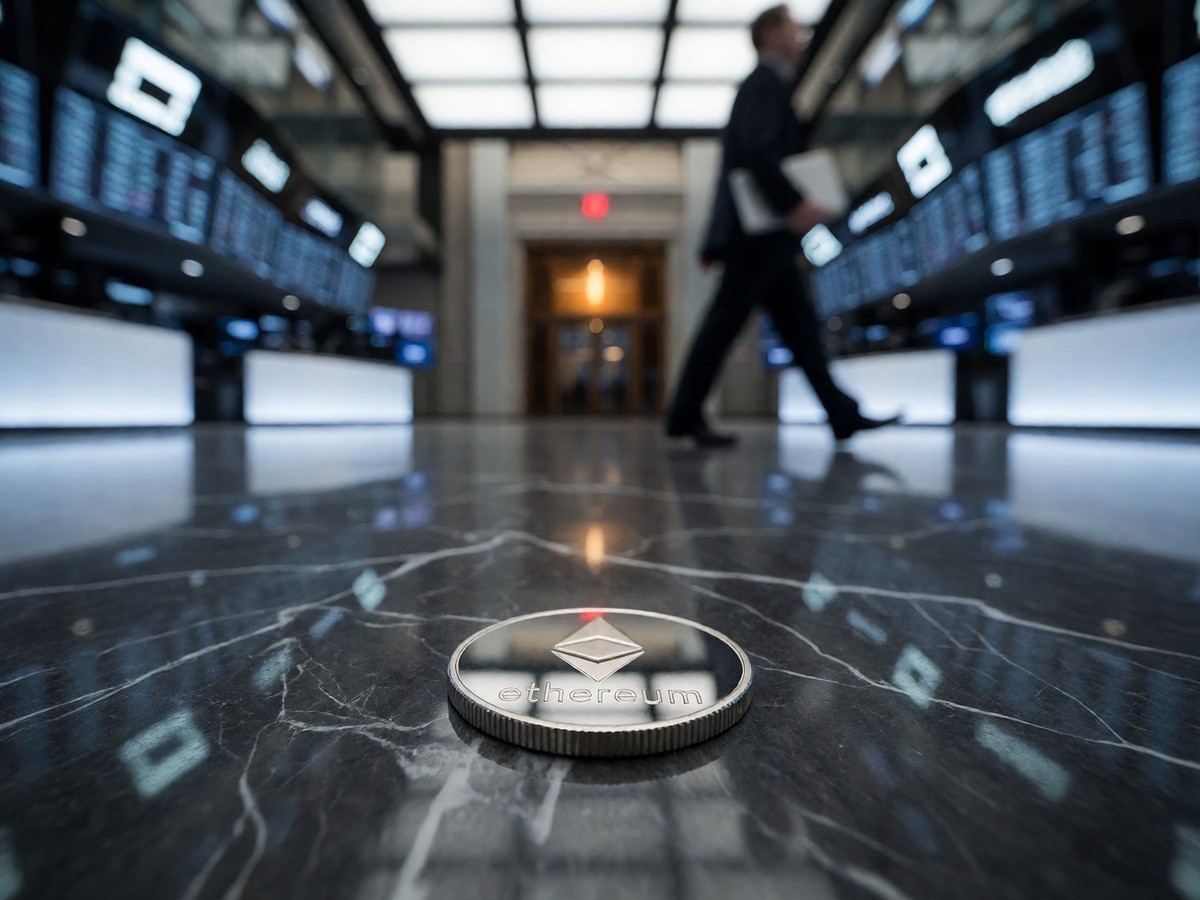
Ethereum trades near $2,505 as of September 14 after failing to sustain its September 11 spike to $2,667. Ethereum price action remains volatile after the asset surged to $2,667 on September 11 following the US Consumer Price Index release, only to slide back below the $2,600 level as traders reacted to hawkish inflation data. This single session saw $250 million in Ethereum liquidations, which was significantly higher than Bitcoin’s $170 million in liquidations. On that same day, transfers of ETH exceeding $1 million jumped 14%. The price must reclaim the $2,700 to $2,800 zone where 10 million ETH holders sit near break-even before a move toward $3,000 becomes realistic. I find the rejection at the $2,600 mark frustrating because the market lacks follow-through despite massive demand. The 200-period EMA at $2,403.7 provides the only defense against a deeper slide toward $2,000. This support level sits directly below the $2,490 to $2,450 range where the current price has been consolidating. The asset has struggled to find direction after falling from its August 2025 peak near $4,958.
Macro headwinds and Bitcoin dormancy
The macro environment complicates this recovery because prediction markets assign an 80% to 87% probability to a Federal Reserve rate hike on September 15 and 16. Higher policy rates raise the opportunity cost for holding ETH. Meanwhile, Bitcoin dormancy metrics suggest a different story after the 1-week to 1-month UTXO age band crossed below the 1-month to 3-month cohort. This specific crossing occurred three times in 2025 and preceded significant price corrections. You should watch if this Bitcoin signal drags the broader market lower.
| Metric | Value |
|---|---|
| ETH ETF Net Inflows (2026) | $863 million |
| Sept 11 ETH ETF Inflows | $216.41 million |
| BlackRock ETHA Sept 11 Inflow | $148.8 million |
| Bitmine ETH Holdings | 5.9 million ETH |
Institutional demand continues to diverge from Bitcoin as Ethereum spot ETFs recorded $216.41 million in inflows on September 11 alone. BlackRock’s ETHA absorbed $148.8 million during that period, marking its largest single day since January. While Bitcoin spot ETFs saw money leave, Ethereum alone recorded net inflows that day. This strength appears in the yearly totals, as Ethereum spot ETFs sit at $863 million in net inflows for 2026, while Bitcoin spot ETFs show a $1 billion net negative. I find the ETH/BTC pair at a 10-month low to be a discouraging sign for those looking for a quick decoupling.
Whale accumulation and the path to $3,000
Whale accumulation provides a structural floor that retail volatility cannot break. On-chain data shows the realized price for accumulation addresses climbed from $1,560 in June to nearly $3,000. Bitmine, chaired by Tom Lee, holds 5.9 million ETH, which accounts for 4.9% of the total circulating supply. I find the supply wall at $2,700 to $2,800, where 10 million ETH changed hands, to be the most difficult obstacle for bulls. Because every one of those holders sits near break-even, this zone creates a heavy ceiling. If the Federal Reserve maintains a hawkish stance, will the institutional bid from ETFs be enough to push ETH past this $2,600 barrier?
The market remains stuck in a range between $2,450 and $2,600 as traders wait for the Fed decision. The RSI sits at 50.09, which indicates neutral momentum. If the price closes below $2,400, it breaks both the horizontal support and the 200 EMA in a single move. Such a breakdown would invalidate the higher-low structure built since September 3. I would expect a move toward the $2,220 level if that support fails. The Glamsterdam upgrade has also slipped to Q4 2026, with the Sepolia testnet fork scheduled for 28 September.