 Bitcoin News
Bitcoin myths and facts after Maelstrom liquidation and Deribit expiry

The Max Pain Myth and Volatility Reality
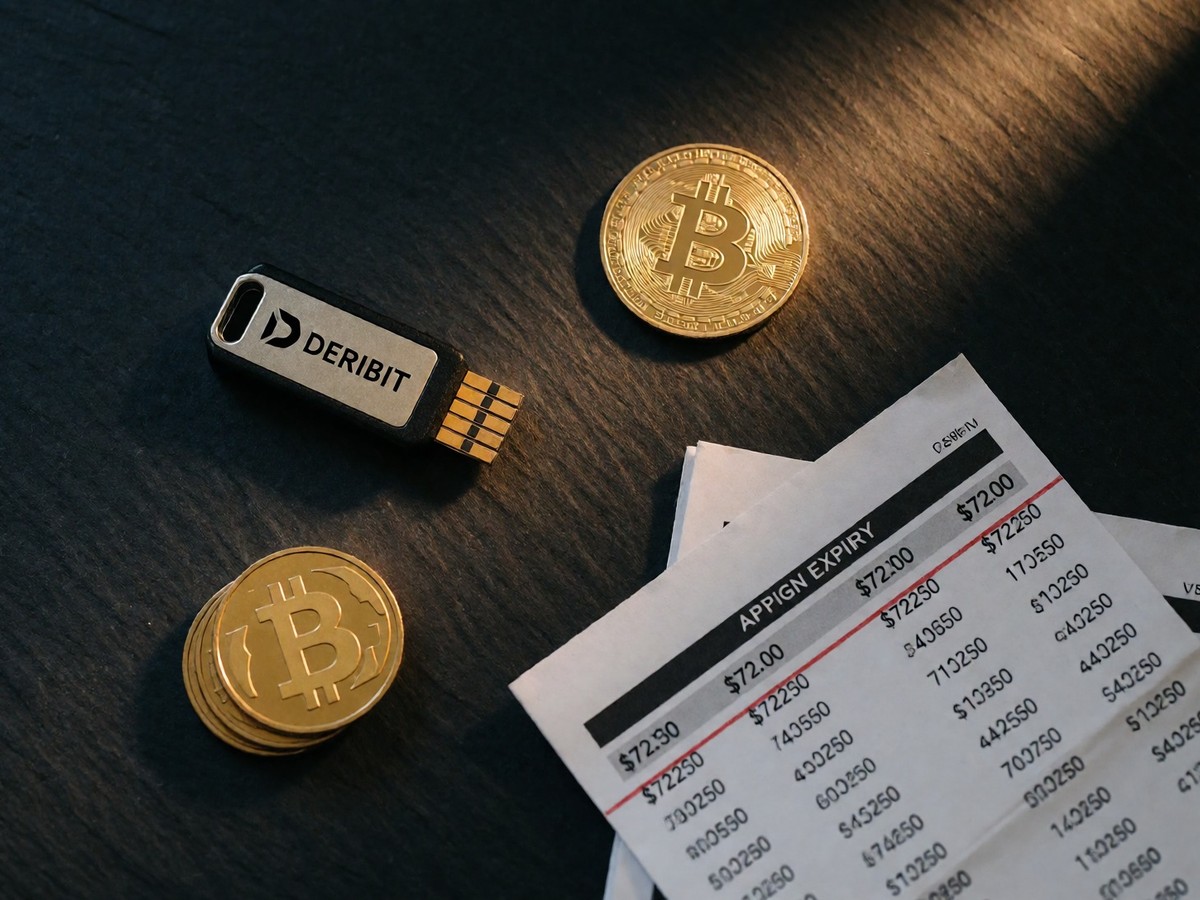
Deribit CEO Luuk Strijvers expects subdued volatility despite large options expiries. On September 25, 2026, Bitcoin options worth $14.63 billion expired on the Deribit platform. The spot price for Bitcoin on that day sat near $85,500, which remained significantly above the $72,000 to $75,000 max pain level. Max pain describes the strike price where the largest dollar value of open contracts expires worthless. Because the price stayed above that zone, the theory that market makers force the price toward the max pain strike did not happen. This expiry included $1.93 billion in Ethereum options. The put/call ratio for Bitcoin at this expiry sat at 0.52, while the ratio for Ethereum sat at 0.57. This indicates that call options outweighed put options. The Deribit Implied Volatility Index, or DVOL, sat at 46, a level comparable to the end of August 2024. This low volatility signals limited expectations for sharp price action. Analysts at QCP Capital previously flagged $85,000 as a max pain point when Bitcoin traded at $87,016. Even after news of U.S. tariffs on vehicles, the DVOL slid toward 46. Deribit holds $27 billion in open interest for Bitcoin contracts. Traders also watched the $88,000 Bitcoin max pain and $3,100 Ethereum max pain levels.
Liquidations do not break market infrastructure
The massive liquidation of $1.8 billion on June 2, 2026, targeted mostly bullish positions, with $1.35 billion of that total tied to long trades, yet the underlying crypto market infrastructure functioned normally through the entire period and avoided any major protocol failures or exchange collapses. This liquidation event remains the largest single-day flush since February 2026. While $110 billion vanished from the total cryptocurrency market capitalization in a single 24-hour period on June 2, stablecoins maintained their pegs. DeFi lending markets continued to function with $58 billion in total value locked. Bitcoin fell about 50% from its October 2025 high of $126,200 to the $60,000 range during this period. In May 2026, U.S. spot Bitcoin ETFs recorded $2.43 billion in outflows, marking the largest monthly withdrawal of that year. Strategy also sold 32 Bitcoin to fund preferred-share dividends. This selloff followed broader economic pressures, including high delinquency rates on U.S. credit cards and inflation. The current market correction reflects macroeconomic pressure and liquidity shifts rather than a fundamental failure of the Bitcoin network. Bitcoin recently reached a record high of $126,199 before slipping toward $121,353.
Is the current cycle reaching its bottom?
Bitcoin follows a four-year cycle where prices often drop following a halving event. The 2020-2021 cycle showed a climb from the 10,000 range toward 69,000, while the 2022 bear market saw a plunge from 69,000 to near 15,000 caused by Luna and FTX collapses. The 2023-2024 recovery saw Bitcoin stabilize between $20,000 and $40,000 before a rally driven by ETF approval expectations. Steven McClurg of Canary Capital notes that after Bitcoin topped out at $126,000 in October last year, the market entered a downtrend. He expects digital asset prices to bottom in October this year. His long-term forecast suggests Bitcoin could reach $200,000 to $250,000 by 2027. On-chain data from Axel Adler provides a different perspective on the market bottom. Long-term investors hold approximately 12.17 million BTC, but this remains below the 15 million to 19.7 million BTC seen at previous bear market lows. A true bottom requires long-term investor supply to exceed 15 million BTC. McClurg advises investors to hold cash and focus on assets with utility, such as Ripple or Hedera, during downturns. He also notes the influence of Korean investors, where Bitcoin trading volume in won often surpasses volume in dollars. Will the supply of long-term investors reach the 15 million BTC threshold required to confirm this bottom?
Forecasted price ranges for late 2026
Traders use various scenarios to project the 2026 trajectory. FintechZoom uses a weighted framework to calculate expected outcomes. This framework uses 40 percent historical pattern weighting, 30 percent current fundamentals, 20 percent macro factors, and 10 percent black swan contingency.
| Scenario | Probability | Price Range |
|---|---|---|
| Bull Case | 35% | $120,000 – $150,000 |
| Base Case | 45% | $60,000 – $90,000 |
| Bear Case | 20% | $30,000 – $50,000 |
The bull case requires positive ETF inflows and rate cuts. The base case assumes volatility stays within healthy bounds and ETF demand stabilizes. The bear case depends on a global recession or major regulatory restrictions. Analyst Dr. Profit identifies a bearish flag pattern on the daily chart. He predicts a move to the $54,000 to $56,000 range first, then a drop to a bottom between $40,000 and $50,000. This prediction follows the drop from the May peak of $82,000 to below $60,000 in June. Support remains near the $117,000 to $120,000 range where 190,000 BTC changed hands. Support also exists in the $70,000 to $75,000 region. You should watch the $117,000 to $120,000 support range if you want to see where buyers defend entry zones. Resistance sits at $85,000 to $90,000.