
 Bitcoin News
FBTC handles the November surge well

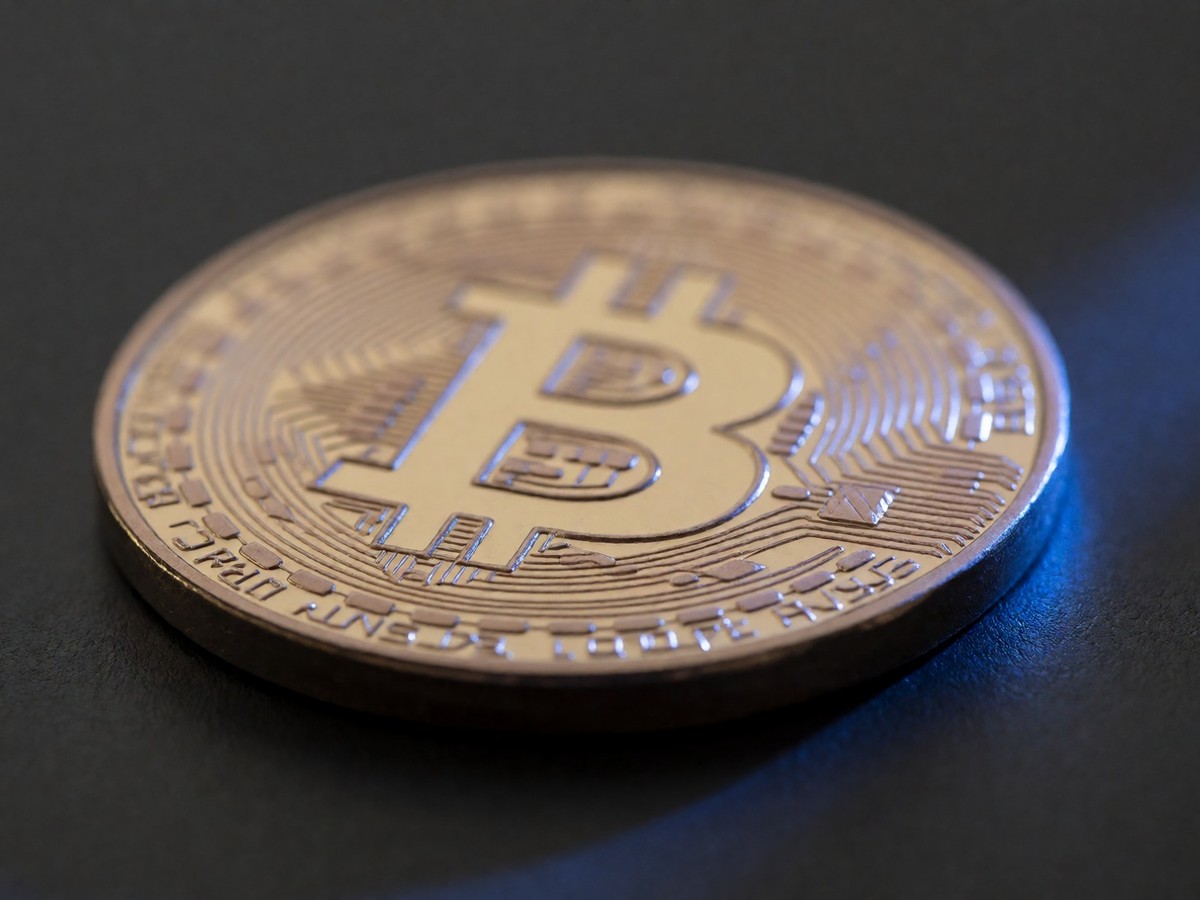
Fidelity’s FBTC captures the $2.1 billion retail inflow surge seen this month. I find the 0.25% expense ratio makes the fund the best option for cost-sensitive index buyers. Net assets for FBTC sit at $13.47 billion. The fund’s price shows recent volatility, with a day high of 69.16 and a day low of 65.59. The previous close was 69.60. Trading volume reached 6,318,178, which is well above the average volume of 3,640,059. This price reflects trading activity during the overnight session on the Blue Ocean ATS, which is available from 8 PM to 4 AM ET, Sunday through Thursday. The index uses bitcoin price feeds from eligible bitcoin spot markets and a volume-weighted median price methodology. This methodology calculates data every 15 seconds based on rolling sixty-minute increments. All of the trust’s bitcoin remains with the custodian. The 52-week high for the fund hit 92.71 and the 52-week low was 50.48. Trailing returns for the fund are calculated as of 11/4/2026.
Schwab reacts to advisor integration
The decision by Schwab to waive commissions for crypto ETFs follows the 34% integration of these assets into advisor platforms, which forced their hand against the Bitcoin futures limited partnership recently launched by Vanguard. BlackRock’s IBIT holds 53.1% of the market with $71.26 billion in assets. FBTC holds a 24.5% share with $32.86 billion in assets. Grayscale’s GBTC retains 11.5% of the market with $15.39 billion in assets. Other issuers like ARK 21Shares hold 4.2% with $5.6 billion, while Bitwise holds 2.8% with $3.8 billion. Invesco and Galaxy hold 1.4% with $1.9 billion. The remaining 2.5% of the market is split across other issuers like Franklin and VanEck. I find the GBTC fee stack a major problem for investors trying to avoid alpha leakage. IBIT and FBTC compete on basis points and spread tightness. They also compete on securities lending revenue shared with authorized participants. Allocators migrate toward these lower-fee, higher-liquidity spot products to avoid the decay seen in legacy vehicles.
Why allocator capital drives the market
The market structure changed because the marginal buyer changed. Allocators use ETFs for regulated exposure. They do not engage in the same panic as retail traders. These investors use rebalancing to maintain target weights. This process keeps volatility lower than the 2021 cycle. I note that institutions treat these products as diversifiers rather than pure bets. The 2026 cycle relies on allocator capital flowing through ETF wrappers. These funds move money based on quarterly rebalances. In the first weeks of April 2026, inflows reached $2.43 billion, which was nearly double the $1.32 billion seen in March. This follows a difficult start to the year where US-listed spot Bitcoin ETFs saw $500 million in net outflows in the first quarter. Bitcoin fell from around $87,500 at the start of the year to approximately $66,600 by quarter-end. This price action contributed to uneven ETF flows. Corporate Bitcoin treasuries reached record levels in early 2026, with public companies holding over 1.1 million BTC. Strategy, formerly MicroStrategy, remains the standout performer in this category with its aggressive accumulation.
Comparing FBTC to its rivals
The November price recovery follows a period of extreme volatility. Bitcoin fell below $78,000 on October 30 after the Binance security incident, which involved an estimated $6.3 billion hot-wallet breach. The asset reclaimed $80,000 on November 4. You already know the difference between owning a fund and owning the coin, but the fee gap between FBTC and GBTC determines how much capital you lose to management. Will the recent Schwab waiver prevent more capital from moving to Vanguard’s futures product? ETF holders do not own Bitcoin directly; they own a share of a fund. They cannot self-custody or move BTC on-chain. Most serious allocators in 2026 use both the ETF and direct ownership. OTC desks allow for large orders without moving the spot price, providing the same execution model that ETFs use.
| Metric | FBTC Value |
|---|---|
| Net Assets | $13.47B |
| Expense Ratio | 0.25% |
| Previous Close | 69.60 |
| Day High | 69.16 |
| Day Low | 65.59 |
| 52-Week High | 92.71 |
| 52-Week Low | 50.48 |
I recommend FBTC for those seeking a low-cost entry into the market.